continuous trait power analysis plot
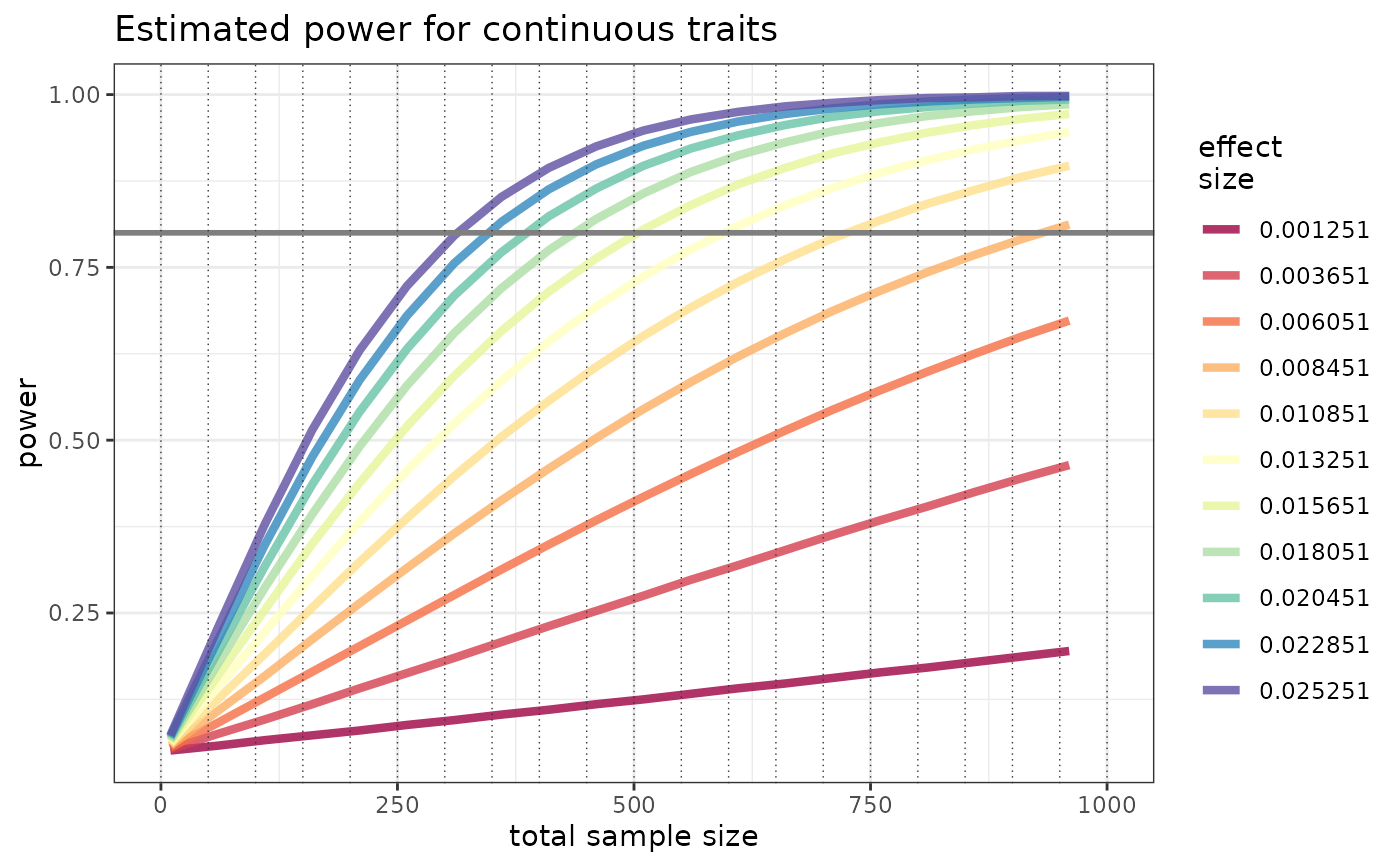
continuous_power_plot.RdThis function (1) identifies an informative distribution of effect and power estimates given your datas total sample size and (2) returns a summary plot.
Examples
ex_data = matrix(NA, 1000, 2)
continuous_power_plot( ex_data )
#> Warning: Using `size` aesthetic for lines was deprecated in ggplot2 3.4.0.
#> ℹ Please use `linewidth` instead.
#> ℹ The deprecated feature was likely used in the metaboprep package.
#>   Please report the issue to the authors.