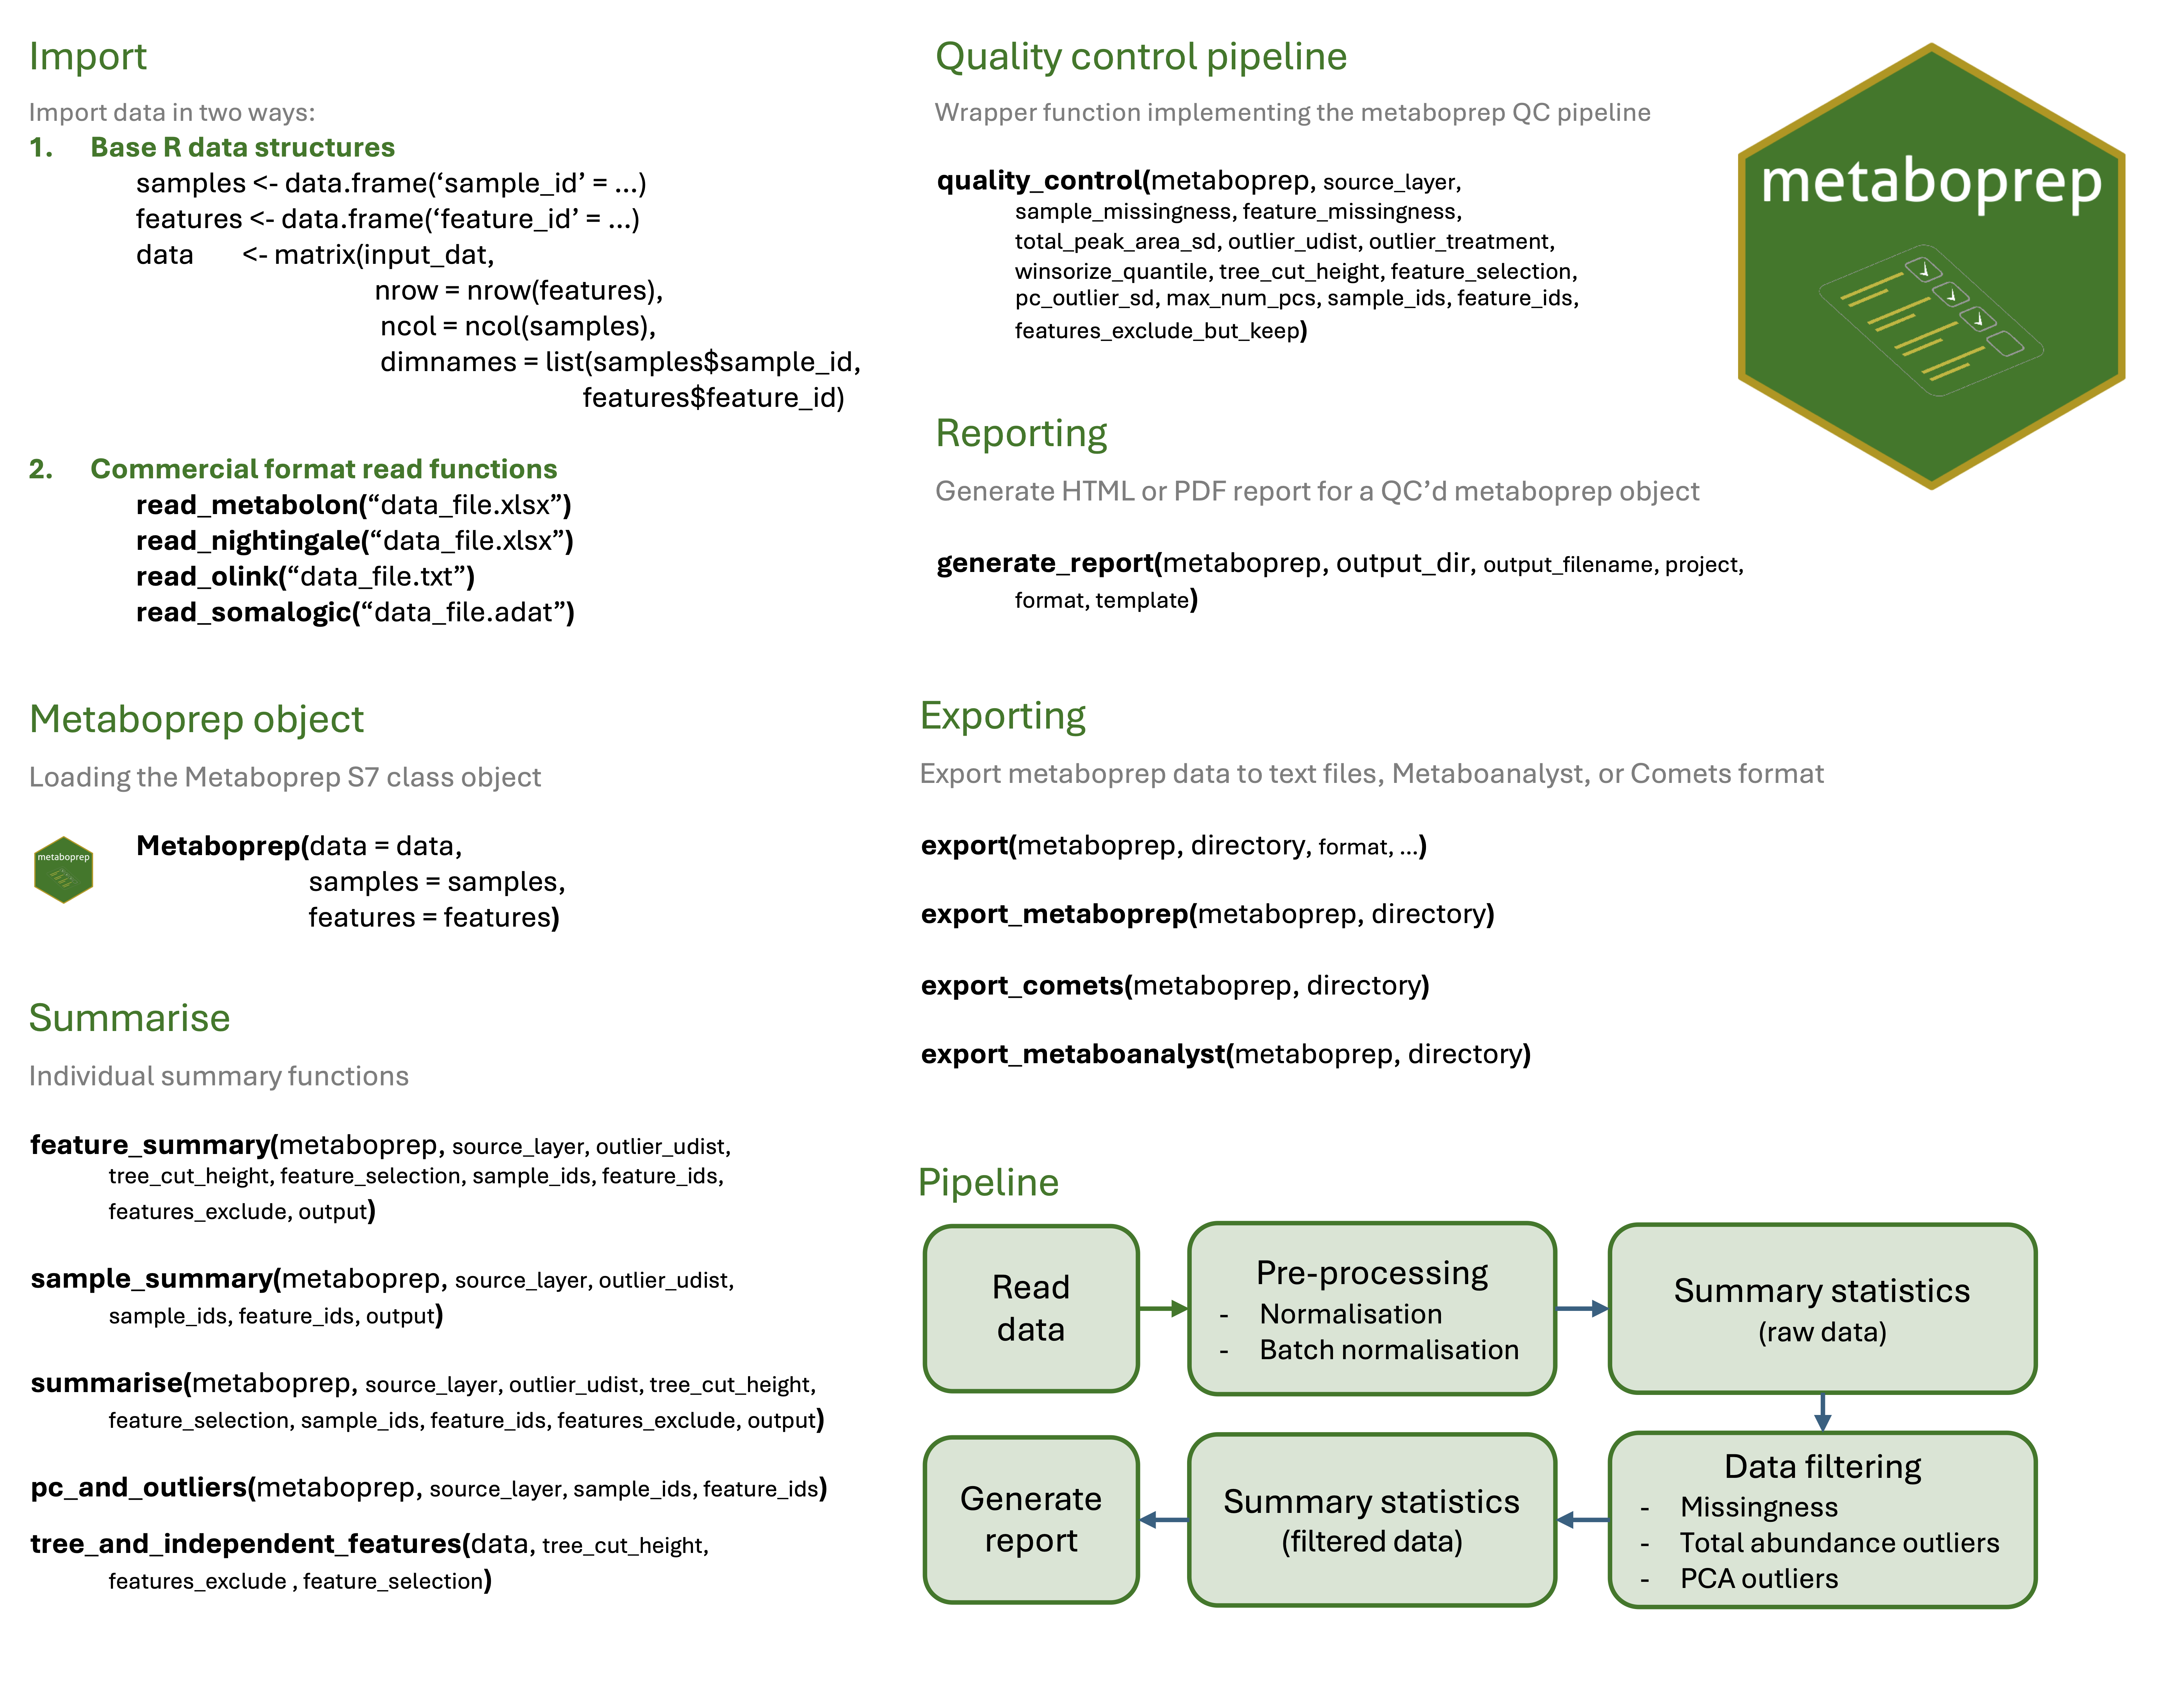
The goal of metaboprep is to:
- Read in and processes (un)targeted metabolite data, saving datasets in tab-delimited format for use elsewhere
- Provide useful summary data in the form of tab-delimited text file and a html report.
- Perform data filtering on the data set using a standard pipeline and according to user-defined thresholds.
Installation
You can install the development version of metaboprep from GitHub with:
# install.packages("pak")
pak::pak("MRCIEU/metaboprep")Example
This is a basic example which shows you how to load data and run the metaboprep quality control pipeline.
Read data into R and create the Metaboprep object
library(metaboprep)

# import data
mydata <- read_metabolon(system.file("extdata", "metabolon_v1.1_example.xlsx", package = "metaboprep"),
                         sheet             = "OrigScale", ## The name of the sheet in the excel file to read in
                         return_Metaboprep = FALSE        ## Whether to return a Metaboprep object (TRUE) or a list (FALSE)
                         )

# create metaboprep object
mydata <- Metaboprep(data     = mydata$data,
                     features = mydata$features,
                     samples  = mydata$samples)
Run the quality control pipeline
# run QC
mydata <- mydata |> quality_control( source_layer        = "input",
                                     sample_missingness  = 0.2,
                                     feature_missingness = 0.2,
                                     total_peak_area_sd  = 5,
                                     outlier_udist       = 5,
                                     outlier_treatment   = "leave_be",
                                     winsorize_quantile  = 1.0,
                                     tree_cut_height     = 0.5,
                                     pc_outlier_sd       = 5,
                                     sample_ids          = NULL,
                                     feature_ids         = NULL)
#>
#> ── Starting Metabolite QC Process ──────────────────────────────────────────────
#> ℹ Validating input parameters✔ Validating input parameters [4ms]
#> ℹ Sample & Feature Summary Statistics for raw data✔ Sample & Feature Summary Statistics for raw data [540ms]
#> ℹ Copying input data to new 'qc' data layer✔ Copying input data to new 'qc' data layer [10ms]
#> ℹ Assessing for extreme sample missingness >=80% - excluding 0 sample(s)✔ Assessing for extreme sample missingness >=80% - excluding 0 sample(s) [7ms]
#> ℹ Assessing for extreme feature missingness >=80% - excluding 0 feature(s)✔ Assessing for extreme feature missingness >=80% - excluding 0 feature(s) [7ms]
#> ℹ Assessing for sample missingness at specified level of >=20% - excluding 0 sa…✔ Assessing for sample missingness at specified level of >=20% - excluding 2 sa…
#> ℹ Assessing for feature missingness at specified level of >=20% - excluding 0 f…✔ Assessing for feature missingness at specified level of >=20% - excluding 0 f…
#> ℹ Calculating total peak abundance outliers at +/- 5 Sdev - excluding 0 sample(…✔ Calculating total peak abundance outliers at +/- 5 Sdev - excluding 0 sample(…
#> ℹ Running sample data PCA outlier analysis at +/- 5 Sdev✔ Running sample data PCA outlier analysis at +/- 5 Sdev [8ms]
#> ℹ Sample PCA outlier analysis - re-identify feature independence and PC outlier…ℹ Sample PCA outlier analysis - re-identify feature independence and PC outlier…                                                                                 ! The stated max PCs [max_num_pcs=10] to use in PCA outlier assessment is greater than the number of available informative PCs [2]
#> ℹ Sample PCA outlier analysis - re-identify feature independence and PC outlier…✔ Sample PCA outlier analysis - re-identify feature independence and PC outlier…
#> ℹ Creating final QC dataset...✔ Creating final QC dataset... [409ms]
#> ℹ Metabolite QC Process Completed✔ Metabolite QC Process Completed [9ms]
View a summary of the Metaboprep object
# view summary
summary(mydata)
#>
#> Metaboprep Object Summary
#> --------------------------
#> Samples      : 100
#> Features     : 100
#> Data Layers  : 2
#> Layer Names  : input, qc
#>
#> Sample Summary Layers : input, qc
#> Feature Summary Layers: input, qc
#>
#> Sample Annotation (metadata):
#>   Columns: 8
#>   Names  : sample_id, neg, pos, run_day, box_id, lot, reason_excluded, excluded
#>
#> Feature Annotation (metadata):
#>   Columns: 8
#>   Names  : feature_id, metabolite_id, platform, pathway, kegg, group_hmdb, reason_excluded, excluded
#>
#> Exclusion Codes Summary:
#>
#>   Sample Exclusions:
#> Exclusion | Count
#> -----------------
#> user_excluded                     | 0
#> extreme_sample_missingness        | 0
#> user_defined_sample_missingness   | 2
#> user_defined_sample_totalpeakarea | 0
#> user_defined_sample_pca_outlier   | 0
#>
#>   Feature Exclusions:
#> Exclusion | Count
#> -----------------
#> user_excluded                    | 0
#> extreme_feature_missingness      | 0
#> user_defined_feature_missingness | 0

